Honors Scholars
The Clark Honors College proudly welcomes a remarkable group of first-year students representing 8 percent of the incoming class. These scholars bring with them a spirit of inquiry, leadership, and creativity that’s redefining what it means to be a Duck.

Most excited about: "I'm most excited about living on campus and getting involved with student life. Sporting events and community events seem like a great aspect of the school."

Most excited about: "The opportunity to meet new people. Going to such a large school is going to be great because there will always be new connections to form."

Most excited about: "I’m most excited to meet new people from all over the world and of different backgrounds on campus and while I study abroad. I look forward to getting to know my peers and professors."
Top Majors
The UO offers more than 200 undergraduate programs. These are the top 15 requested majors in alphabetical order:
- Advertising
- Architecture
- Biochemistry
- Biology
- Business Administration
- Computer Science
- Educational Foundations
- Environmental Science
- Human Physiology
- Journalism
- Marine Biology
- Music
- Neuroscience
- Political Science
- Psychology
School and College Breakdown
Percentage of first-year students by school or college major:
43% | College of Arts and Sciences |
8% | Clark Honors College |
5% | School of Journalism and Communication |
2% | School of Music and Dance |
27% | College of Business |
5% | College of Design |
3% | College of Education |
1% | Ballmer Institute for Children’s Behavioral Health |
Racial Diversity Breakdown
- 18% Hispanic or Latino
- 14% Asian
- 8% Black or African American
- 3% Native American or Alaska Native
- 2% Native Hawaiian or Pacific Islander
These numbers add up to more than 39 percent because many students identify with more than one race or ethnicity.
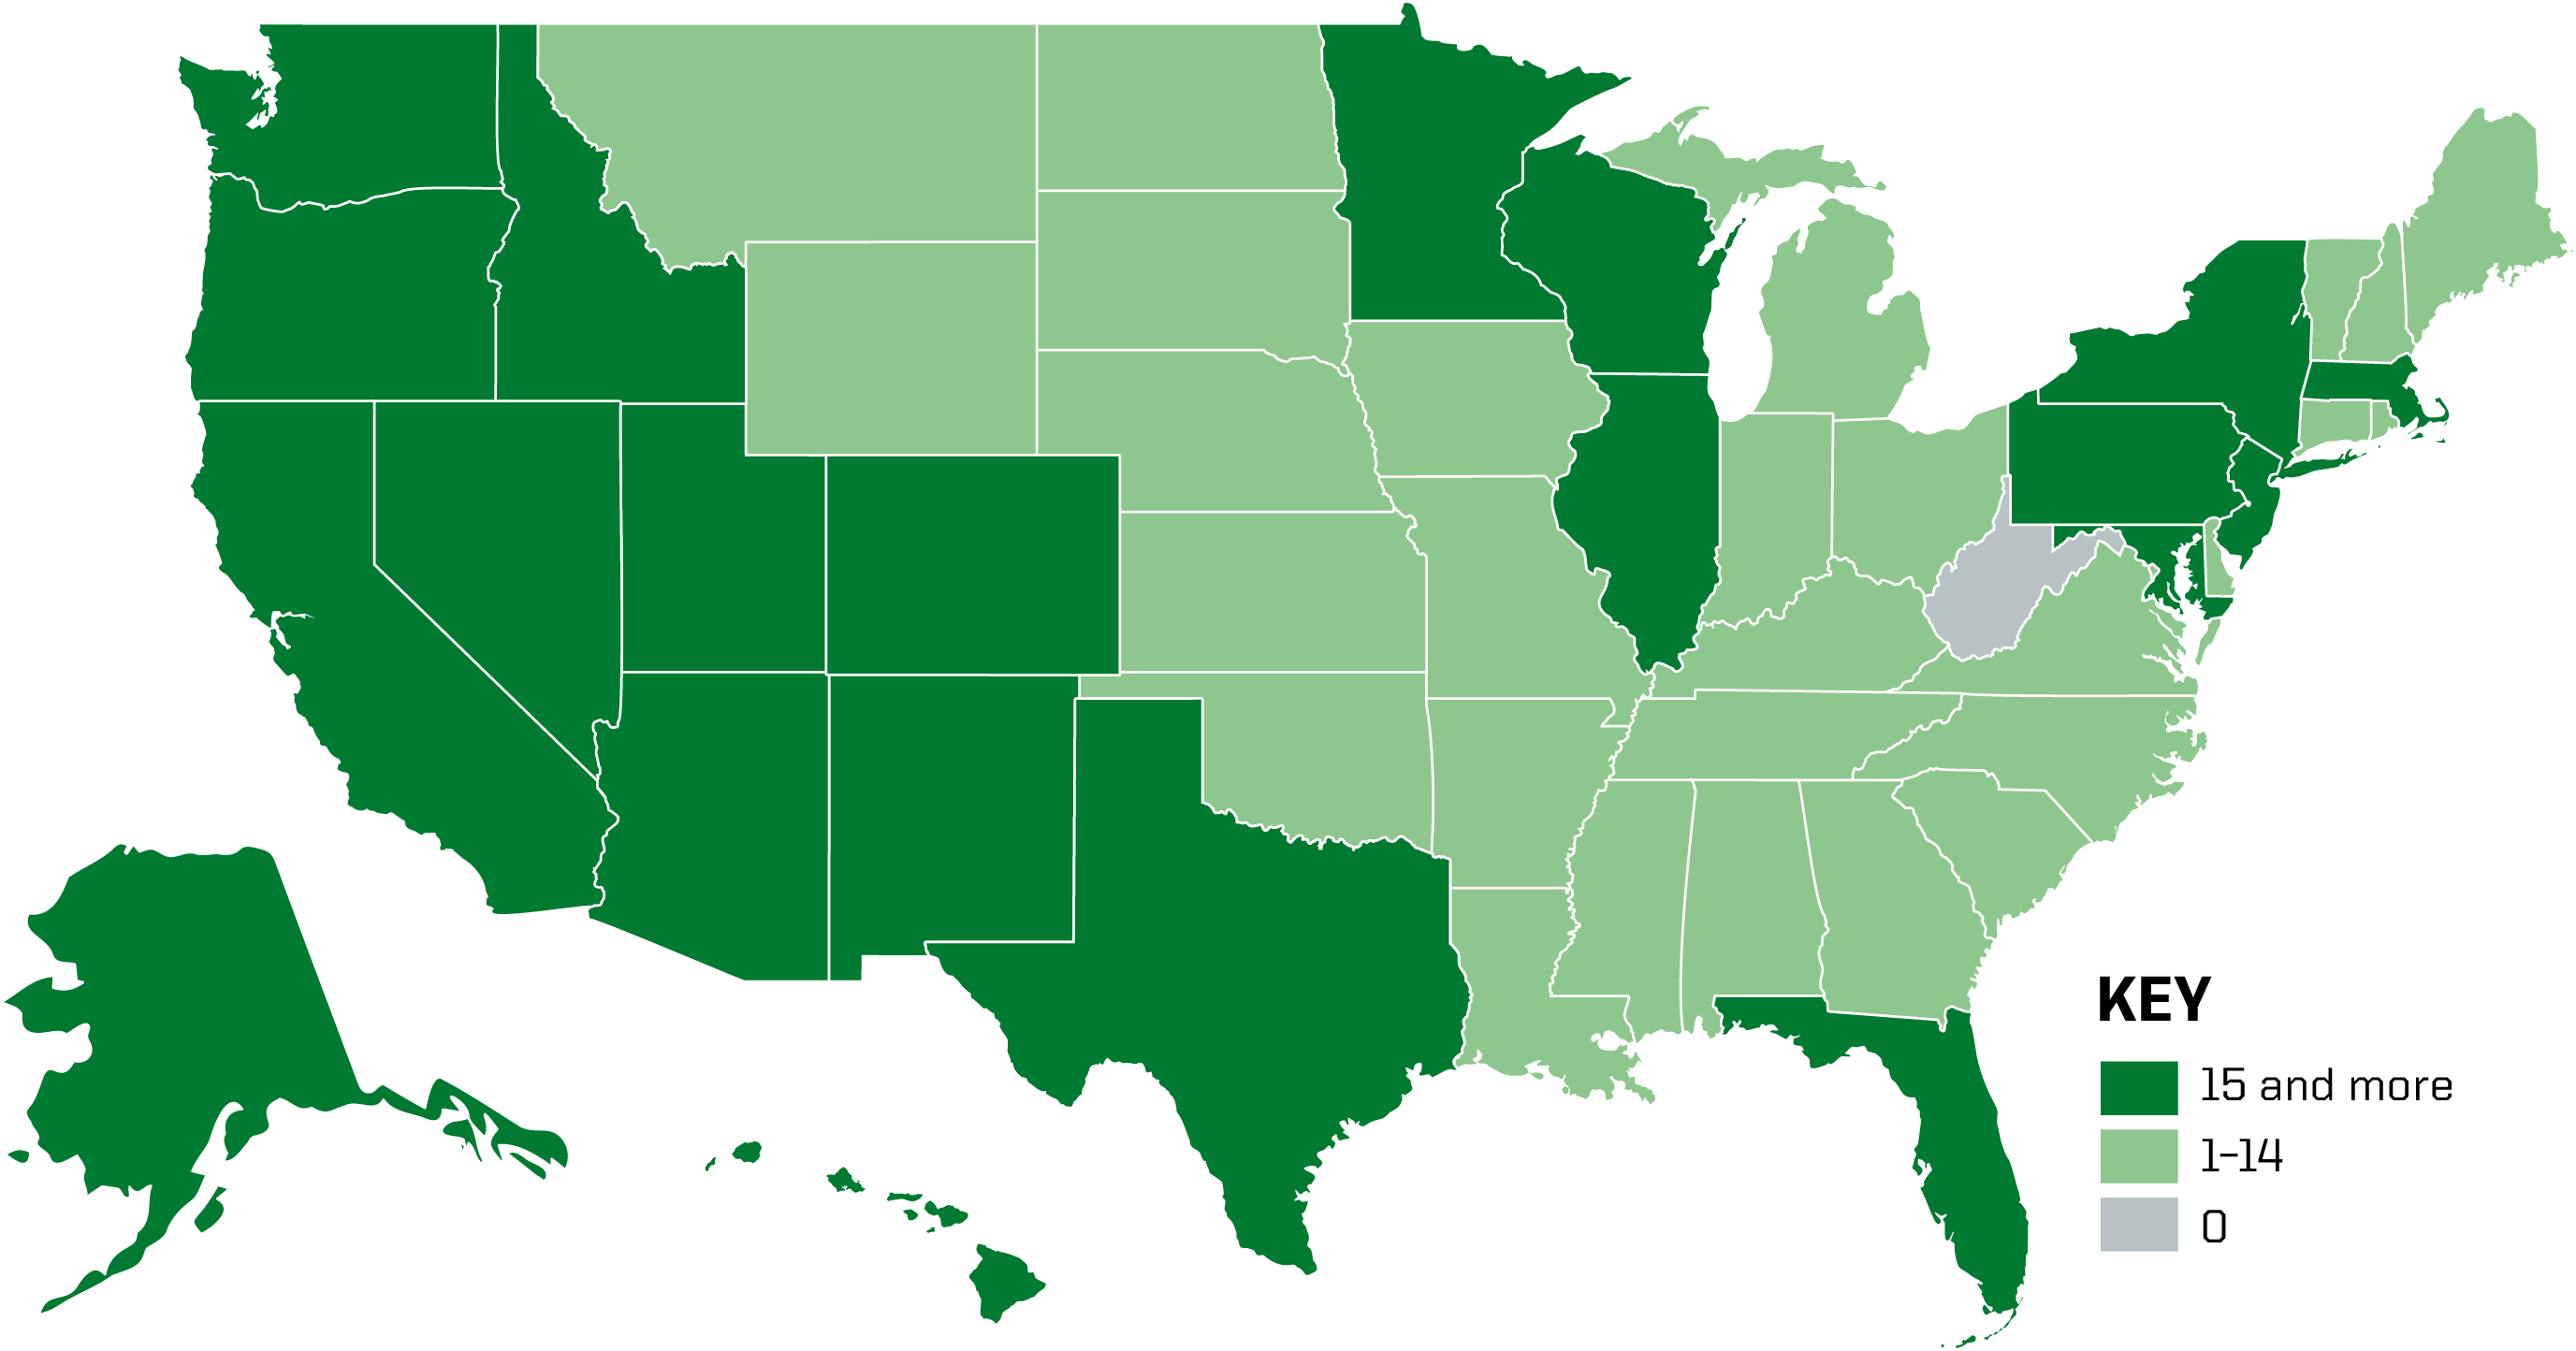
Top States for Migrating Ducks
Our first-year students represent 49 of the 50 states, plus the District of Columbia. The dark green states represent those with 15 or more Ducks in the Class of 2029:
- Oregon
- California
- Washington
- Colorado
- Texas
- Hawaii
- Illinois
- Arizona
- Nevada
- Minnesota
- Florida
- Utah
- Wisconsin
- Idaho
- Pennsylvania
- New Jersey
- New Mexico
- Massachusetts
- Alaska
- New York
- Maryland
PathwayOregon ensures that academically qualified, Federal Pell Grant-eligible Oregonians will have 100 percent of their undergraduate tuition and fees covered. In addition to financial support, the program provides comprehensive academic support and career guidance.
All fall 2025 numbers on this page represent preliminary day-one enrollment. This may differ from official fourth-week census reporting available later in the fall. Fall counts include students who started in the summer term and continue in the fall. Source: University of Oregon SSEM Research and Assessment day-one reporting. Data prepared on September 29, 2025.